4. PowerPivot
We’ve looked at PerformancePoint and how it can be
used to build powerful business process management solutions using the
SharePoint platform. Such solutions are excellent for providing
day-to-day management information or other business information, for
which the requirements can be easily defined and implemented. However,
one of the common stumbling
blocks in large-scale BI projects is that too often the project becomes
a victim of its own success. A project may start off with a range of
commonly used line-of-business reports, but over time, more and more
requests for additional reports or changes to existing reports can
overwhelm available development resources. When this happens, users who
are unable or unwilling to wait until a suitable resource is available
often resort to cobbling together their own solutions using Excel,
Access, or some other tool. Each homegrown solution is a step farther
away from the BI mantra of one version of the truth, and over time, a
lot of the good work done on the project is lost.
Thankfully, it doesn’t have to be this way. The
solution to this problem is to empower users to create their own ad hoc
reports using a series of common data sources. Historically, solutions
to this problem have focused on the front end, presentation layer of
report generation. Tools such as Reporting Services include a report
builder with which users can create reports from published data sources.
Although this approach does go a long way toward reducing the burden on
development resources, the presentation layer is probably the least
time-consuming aspect of report generation. Where the hard work comes in
is at the data warehousing and OLAP layers, and tools such as Report
Builder don’t provide any assistance here.
With SQL Server 2008 R2, Microsoft includes a new product known as PowerPivot.
PivotTables are a well-known and widely used feature of Excel,
especially when it comes to analyzing business data. However,
PivotTables have their limitations, and one of the most significant with
respect to this discussion is in the selection of data sources.
PivotTables can either make use of data within a workbook or they can be
connected to a predefined data source. You’ve seen that a fair bit of
work is involved in predefining data sources, especially when attempting
to meet specific reporting requirements. PowerPivot addresses these
issues by allowing users to create their own data sources from a mash-up
of existing sources. Additionally, PowerPivot lets users work with much
larger datasets that would normally be possible using PivotTables.
In effect, PowerPivot is a user-driven OLAP tool. It
allows users to create in-memory OLAP cubes and uses those cubes within
Excel in the same way as external data sources. Now, the implications of
that are pretty significant, but when coupled with the fact that the
resulting Excel workbooks can then be hosted using Excel services and
accessed as OLAP data sources in their own right, you can see that
PowerPivot truly opens the door to collaborative BI solutions.
PowerPivot Excel Add-In
Users can create PowerPivot data sources using an add-in for Excel 2010 that can be downloaded from www.microsoft.com. Let’s work through an example to see how the add-in works. As earlier, we’ll make use of the AdventureWorks sample databases.
PowerPivot
data is created using Excel 2010, as mentioned. Open the Excel
application and then, from the PowerPivot tab, select PowerPivot Window
from the ribbon, as shown here:

PowerPivot
can import data from a variety of sources, including traditional
sources such as SQL Server and other database systems, as well as other
sources such as Reporting Services reports, ATOM feeds, and other
PowerPivot workbooks. For the purposes of this demonstration, we’ll use
the AdventureWorks database running on SQL Server.
From the Home tab, select From Database in the Get External Data section of the ribbon, and then select From SQL Server.
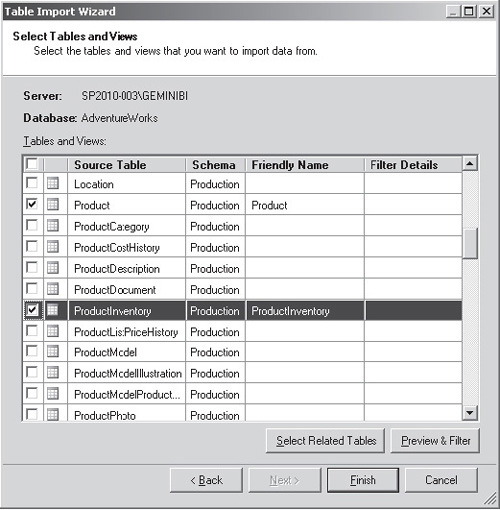
Configure
the connection to connect to the AdventureWorks sample database, and
then select the Product and ProductInventory tables, as shown:
Data
from the selected tables will be imported into PowerPivot and will be
displayed as data grids within individual tabs. As part of the import
process, PowerPivot automatically creates relationships between the two
tables. We can check that these relationships are correct by clicking
the Table tab and then clicking the Manage Relationships button from the
ribbon.
Tip
Creating relationships within PowerPivot is an
important feature. You can import data from a variety of sources and
create relationships between tables from different sources.
Data Analysis Expressions (DAX)
In
the Manage Relationships dialog, you can see that the ProductInventory
table is related to the Product table using ProductId. This relationship
was picked up from the underlying database. We’ll make use of this
relationship to illustrate the use of the new DAX language. DAX uses a
syntax that’s similar to Excel formulae. The main difference is that DAX
functions generally operate on multiple rows of data. In our example,
our function summarizes quantity values from a related table.
In the Product table, select the Column tab, and then click the Add Column button.
In the formula bar, enter the following DAX expression:
=SUMX(RELATEDTABLE('ProductInventory'),
                   'ProductInventory'[Quantity])*'Product'[StandardCost]
Right-click the CalculatedColumn1 header, and then select Rename Column. Change the column name to InventoryCost.
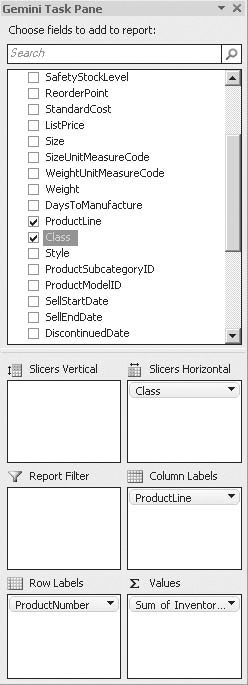
To make use of this data in Excel, switch back to the Home tab and then select PivotTable | Single PivotTable from the ribbon.
We can now create a PivotTable in the usual manner by
adding columns to the appropriate sections. Notice that our calculated
InventoryCost column appears in the list and can be used in the same way
as other columns. We can drag the InventoryCost column into the Values
section of the Gemini Task Panel to create a new summary value named Sum
of InventoryCost, as shown here:
PowerPivot for SharePoint
In addition to the Excel add-in that allows users to
create and use PowerPivot enabled workbooks, another feature of SQL
Server 2008 R2 provides SharePoint integration for PowerPivot. This
allows PowerPivot-enabled workbooks to be hosted by Excel services in
the same way as regular workbooks. Instead of the in-memory version of
Analysis Services that’s used when accessing a PowerPivot-enabled
workbook via the Excel client, when SharePoint integration is
configured, PowerPivot cubes are hosted on-demand by Analysis Services.
Making
use of the simple PowerPivot workbook that we created earlier, we can
publish the workbook to SharePoint. Before we do this, we need to create
a PowerPivot Gallery document library to contain our workbook.
You
publish PowerPivot workbooks in exactly the same way you publish other
Excel content to Excel Services. Select the File tab to enter the
backstage area, and then select Share.
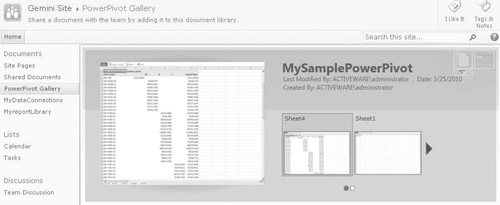
Click
Publish To Excel Services, and then navigate to the PowerPivot gallery
that we created earlier. If everything is set up properly, the workbook
will be uploaded to the library. Navigating to the PowerPivot gallery
will show details of the workbook together with previews of each page:
Now that we’ve published our PowerPivot data source,
we can make use of it as a data source anywhere that can utilize
Analysis Services data. Let’s see this in action by creating a
PerformancePoint dashboard based on our PowerPivot workbook.
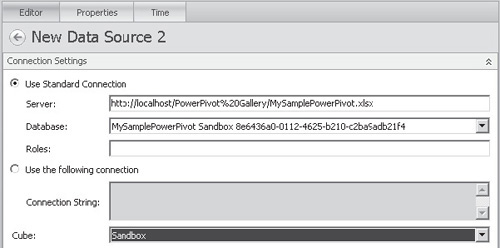
In Dashboard Designer, create a new data source by selecting Data Source from the Create tab.
In the Select a Data Source Template dialog, select Analysis Services.
In
the Connection Settings section, set the Server to the URL for our
sample PowerPivot workbook, and then choose the default Database and
Cube values from the respective drop-downs.
Note
I’ve used localhost as the server name for illustrative purposes. Enter the actual name of your server to prevent security errors.
Using
this new data connection, we can now create dashboards and reports in
the same way we did earlier when addressing the AdventureWorksOLAP data
source.
The real power of PowerPivot on SharePoint is that a
workbook published to Excel Services can be treated in the same way as a
regular OLAP cube. Instead of development resources being tied up
designing and developing every cube using Business Intelligence Studio,
you can now build simple cubes using Excel and PowerPivot. Since the
data is easily accessible, it can be integrated into a wider BI solution
with relatively little effort. As you’ve seen, for example, PowerPivot
data can be used to generate the same dynamic PerformancePoint reports
as OLAP data hosted using Analysis Services.